Cyanne Dunn
·
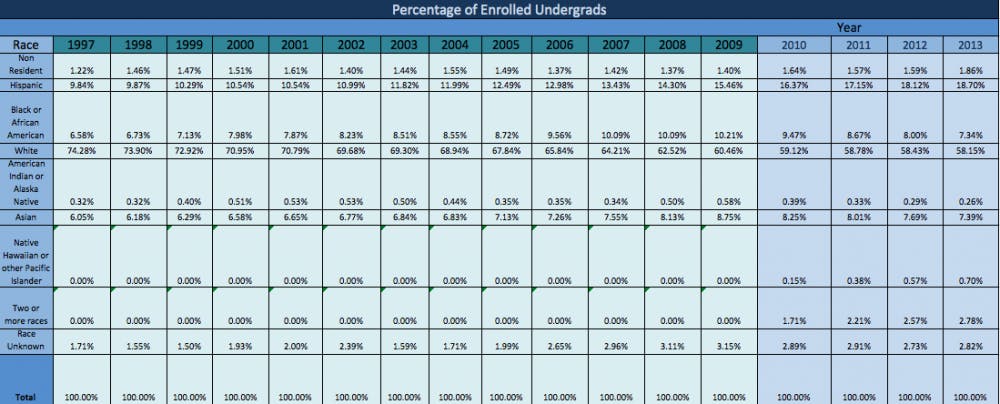
This chart lists the percentage of the total population each race comprises. The color-coordination indicates a 2010 change in how race is recorded from applications. At this time, two new categories were added (two or more races and Native Hawaiian or Pacific Islander). That is why no data exists for these two categories before 2010. The percentages were listed as zero to preserve the formulas used to calculate the percentages.
More

LAXvsLoyolaMD_NoahLantor-2.jpeg
By Noah Lantor | Apr. 26Florida gators attack Jordan Basso (6) hugs teammate Frannie Hahn (16) after she scores a goal in a lacrosse game against Loyola Maryland in Gainesville, Fla., on Saturday, March 8, 2025.

FullSizeRender.jpg.jpg
By Vivienne Serret | Apr. 23Gainesville Mayor Harvey Ward speaks at a vigil for victims of the April 17 Florida State University shooting on Wednesday, April 23, 2025.
