Indiana, Kansas, Gonzaga and No. 8 seed Pittsburgh are the four teams in 2013 that best fit the statistical profile Final Four teams have built during the past 10 years.
Unlike the rest of the field, those four teams meet all of the significant statistical benchmarks that most of the past 40 Final Four teams have surpassed.
Combing through the KenPom.com profiles of every Final Four team since 2003 led to the unearthing of a few trends. Although every team had different strengths and weaknesses, certain areas have, on average, proved to be more conducive to NCAA Tournament success.
Those 40 Final Four teams have an average offensive efficiency rating of 118.3 and an average defensive efficiency rating of 88 — both far cries from the 2013 national average of 100.6. This is not surprising. Teams that do well on offense and defense typically win games.
Going a step further, the numbers get more interesting.
Those 40 Final Four teams have had an average offensive rebounding percentage of 37.6. For a frame of reference, the national average this season is 31.8, and a team with a 37.6 offensive rebounding percentage would rank 23rd in the NCAA.
The other trends involved scoring and limiting easy baskets. The Final Four teams from the past 10 years hit 51.9 percent of their two-point shots and held opponents to just 44 percent. The national average in 2013 is 47.5 percent.
The past 40 Final Four teams also got to the free-throw line and kept opponents off of it. Their average rate of free-throw attempts per field goal attempt on offense was 38.7, while they held their opponents to just 31. The national average in 2013 is 36.
Part of scoring easy baskets has been not taking very many three-pointers. The past 40 Final Four teams have, on average, taken just 30.8 percent of their shots behind the arc. The 2013 national average is 33.
These teams have also been efficient making those shots, connecting an average 36.4 percent of the time. The 2013 NCAA average three-point shooting percentage is 33.9.
The average defensive rebounding percentages, turnover rates, rate at which opponents took three-pointers, tempo, experience and effective height of the 40 Final Four teams were not significantly different from the national averages.
More than just matching these averages to 2013 teams, I wanted to use these figures in an elimination system. The idea stemmed from a column I wrote in November 2011. I said Florida would struggle to make the Final Four in 2012 because no Final Four team had ever taken 44.6 percent of its shots from beyond the arc, as the Gators did.
What other stats are common to all Final Four teams? And what 2013 teams would be statistical outliers because their weaknesses had rarely been seen in teams that had Final Four success?
So, I compiled the efficiency rates, shooting percentages, rebounding rates, turnover percentages, free-throw rates, three-point attempt rates, tempo, experience and effective heights of the past 40 Final Four teams.
Then I lined them up and looked for commonalities and trends. For example, 39 of the 40 ranked 50th or better in offensive efficiency. The next step was to look at the 2013 field and red flag the teams who didn’t meet that qualification.
I ended up with 17 benchmarks that should have been pretty easy for teams to attain. Those can be found on alligatorSports.org, in Table 1. Another four benchmarks were moderately difficult, but had been done by 50-75 percent of the Final Four teams. See Table 2. Another four benchmarks were incredibly difficult to reach, but only applied to about half of the past 40 Final Four teams. See Table 3.
Every team in the field was checked against these benchmarks. The teams are listed down the left column of the tables, while the benchmarks are listed across the top.
Teams that did well — either meeting the baseline marks or excelling in the more difficult areas — moved on to Table 4.
Table 4 shows each of those contending teams and their specific stats. While the baselines are valuable, the actual numbers are more useful in picking winners. To make those numbers legible, they’ve been color-coded. Deeper greens are good, and deeper reds are bad. But not all reds and greens are created equal. The most important stats are in the columns shaded deeper shades of yellow — these are the numbers that have had the greatest correlation to Final Four success.
You can take a look at the tables yourself, so I’ll skip to the results.
For each region, I’ve listed the finalists, how they would be an exception to recent history and my resulting prediction.
Midwest Finalists
-Louisville: Only three teams shot worse than Louisville’s 33.1% on threes.
-Michigan State: Only 10 turned the ball over more than Michigan State’s 20.1%.
-Missouri: Only four had a defensive efficiency rating worse than Missouri’s 93.1.
Only five had OFTA/FGA ratings worse than Missouri’s 35.1.
-Duke: Only six had defensive efficiency ratings worse than Duke’s 90.6.
None had an offensive rebounding rate worse than Duke’s 29.4.
-St. Mary’s: Only two had a defensive efficiency rating worse than St. Mary’s 94.6.
Only five had a DFTA/FGA rate worse than St. Mary’s 37.6.
Only five took a higher percentage of threes than St. Mary’s 38.1.
-Colorado State: Only two had a defensive efficiency worse than Colorado State’s 96.5.
Only two allowed worse than Colorado State’s 46.6% on two-point shots.
Only seven had a DFTA/FGA rating worse than Colorado State’s 36.6.
Only five shot worse than Colorado State’s 33.4% on threes.
Pick: Louisville is better across the board, and Michigan State’s turnover issue would prove costly in a head-to-head matchup.
South Finalists
-Kansas: Met all benchmarks.
-Florida: Only two had a 3PA/FGA mark higher than Florida’s 40.4.
Only one had a FTA/FGA mark lower than Florida’s 29.2.
-Georgetown: Only one had an offensive efficiency rating lower than Georgetown’s 108.
No team had an offensive rebounding rate lower than Georgetown’s 30.6.
Pick: Kansas is one of only four teams to meet all of the initial benchmarks, while Florida and Georgetown would be among the first of their type to succeed.
West Finalists
Gonzaga: Met all benchmarks.
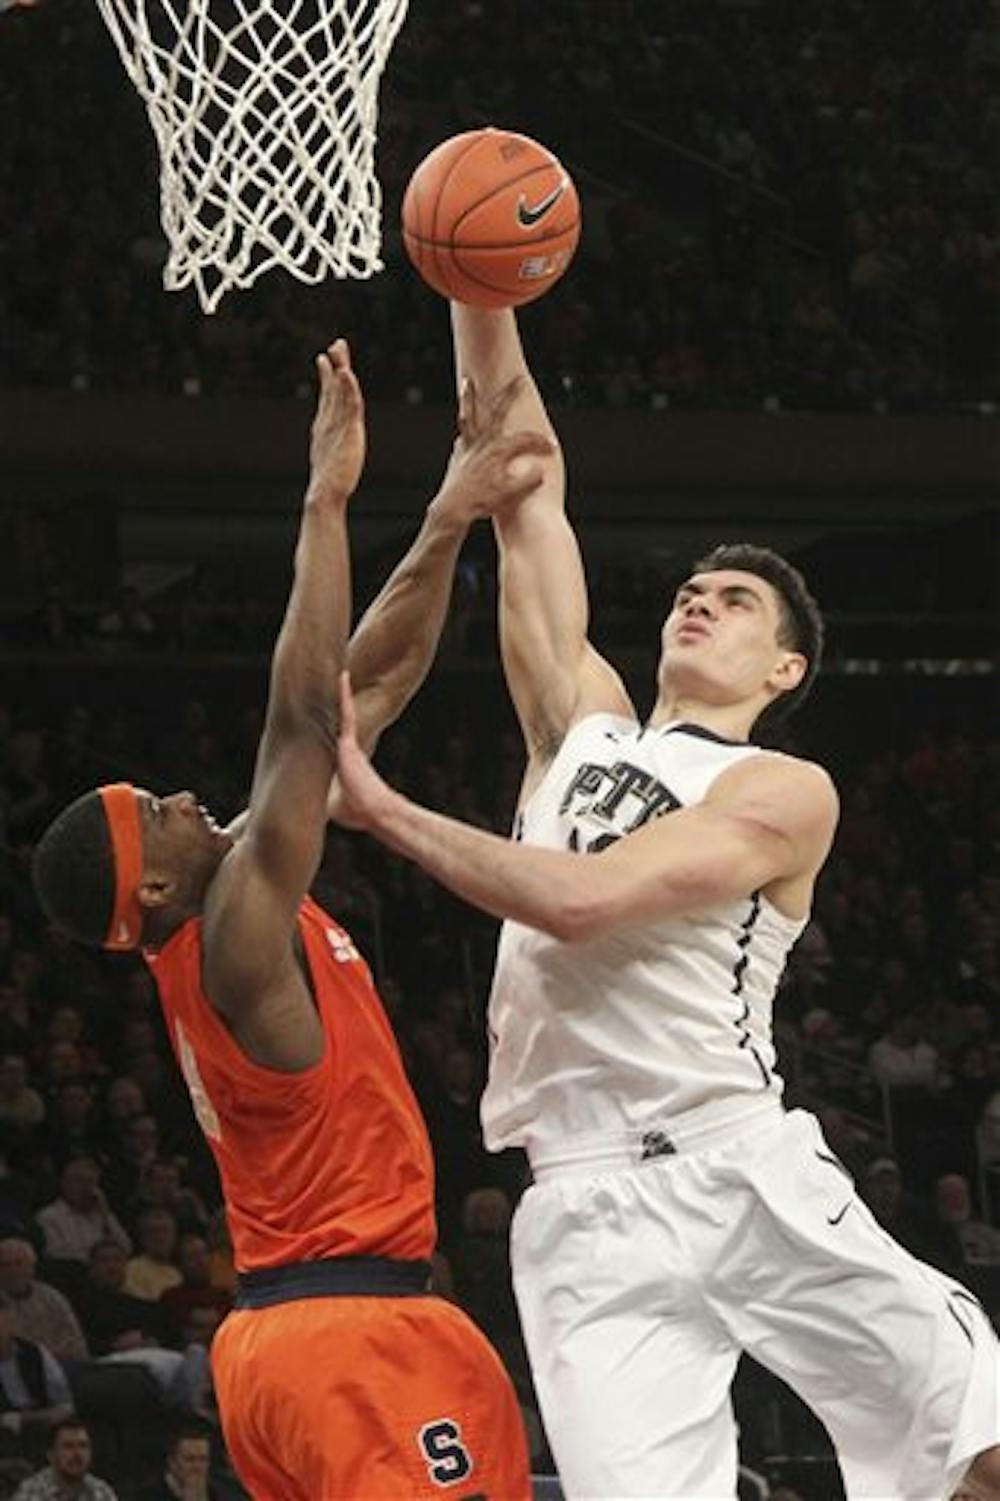
Pittsburgh: Met all benchmarks.
Ohio State: Only three had an OFTA/FGA rating worse than Ohio State’s 34.2.
Only three had an offensive rebounding rate worse than Ohio State’s 32.4.
Arizona: Only four had a defensive efficiency rating worse than Arizona’s 92.
Only five had a 3PA/FGA higher than Arizona’s 37.9.
Notre Dame: Only two had a defensive efficiency rating worse than Notre Dame’s 95.9.
Only one had an OFTA/FGA rating lower than Notre Dame’s 32.2.
Ole Miss: Only three had a defensive efficiency rating worse than Ole Miss’ 93.6.
Only three shot worse than Ole Miss’ 33% on threes.
Resulting pick: The possible round of 32 matchup between Gonzaga and Pitt — the two best teams by these metrics — is soul crushing. While the smart money may be on the Zags, I’ve got to go with the Panthers. I’d be miserable if they came out of this region and I shied away from pulling the trigger.
East Finalists
Indiana: Met all benchmarks.
Miami: Only 10 had a defensive efficiency rating worse than Miami’s 89.7.
Only one had an offensive rebounding rate worse than Miami’s 30.8.
Only five had an OFTA/FGA rate lower than Miami’s 35.2.
Only seven had a 3PA/FGA rate higher than Miami’s 34.9.
N.C. State: Only two have had a defensive efficiency rating worse than N.C. State’s 97.2. No team has ranked lower than N.C. State’s 105th in defensive efficiency.
Only three have allowed more than N.C. State’s 47.7% on two-point field goals.
Resulting Pick: Indiana is the easy selection here. Given the lack of other viable contenders in their bracket, I have a hard time taking anyone else to cut down the nets.
Pittsburgh's Steven Adams (13) goes up past Syracuse's C.J. Fair during the first half of an NCAA college basketball game at the Big East Conference tournament, Thursday, March 14, 2013 in New York. (AP Photo/Mary Altaffer)